

The cold in Yakutsk, Russia. Courtesy of http://www.snowaddiction.org
In the middle of winter in Yakutsk, Russia, the average temperature is -34 °C–so cold that the difference between Celsius and Fahrenheit is negligible. Overnight dips to -42 °C are common. For the 270,000 people who live there, time outside is to be avoided—eyeglasses freeze to your face, eyelashes freeze, your nose hairs freeze. October to April is spent scurrying around from house to house and spending as much time as possible inside.
In July in Kuwait City, Kuwait, the 2.4 million residents endure average highs of 47 °C (116 °F) in the blistering heat of the day. Overnight offers a small amount of relief, at 31 °C (87 °F). Recently a remote area in the northwest of the country hit a blistering 54 °C (129 °F), which may have a planet-wide record. Citizens again stay inside as much as possible, sheltering in the refreshing air conditioning.
The relationship between heat production (metabolic costs) and air temperature is called a Scholander-Irving curve, and is generally “U-shaped”, with increases both above and below the thermoneutral zone. Here we show this relationship for a variety of mammals, with every mammal having a slightly different thermoneutral zone as well as a different slope describing the increased costs at changing temperatures. From Hill et al. 2013, PLoS ONE.
These two cities, opposite in their climate, have one thing in common. Their human residents, as descendants of tropical mammals, cannot handle temperature extremes; in fact, humans are one of the mammals that are least able to withstand temperature variation. As part of their unparalleled success in colonizing the corners of the planet, humans have extended their regulation of body temperature from just their own bodies to the scale of the city. What I’d like to discuss, however, are the accompanying energetic costs.
Generally, mammals such as humans must maintain a relatively constant body temperature in the face of changing external conditions for their physiological functions to continue. This process is called thermoregulation. When their external environment is too cool, mammals expend energy in shivering and other processes to maintain that constant body temperature. When their external environment is too hot, mammals shed heat by sweating, redirecting blood flow, and other physiological processes. The relationship between ambient temperature and a mammal’s metabolic rate is therefore a “U” shape (called a Scholander-Irving curve after its discoverers, Scholander et al., 1950). The range of temperatures in which no additional energy use is needed for thermoregulation is called the “thermoneutral zone”. This zone is particularly narrow in humans.
Humans also have a relationship between energetic costs and ambient temperature. A) This shows the very steep increased cost with decreasing temperature, as well as relatively narrow thermoneutral zone (higher temperatures were not tested). B) How changing insulation changes the shape of the Scholander-Irving curve. C) Houses increase energy usage at low temperatures. D) This can be scaled to the size of a city. From Hill et al. 2013, PLoS ONE.
By building cities, humans have “outsourced” the cost of thermoregulation. Now, instead of expending biological energy to maintain optimal body temperature, we expend fuel. Globally, heating and cooling buildings is responsible for 40% of total energy use and 33% of greenhouse gas emissions (UNEP, 2009). And in fact, if you measure the change in energy consumption in cities over a range of temperatures, you get what looks suspiciously like the Scholander-Irving curve writ large: a city-wide relationship between energy use and ambient temperature (Hill et al., 2013). But this expansion of thermoregulated area doesn’t come cheap—a recent estimate places the increased cost of maintaining an entire house at a comfortable temperature at 50 times the cost of maintaining body temperature for just the people in it (Meehan, 2012).
This outsourcing of thermoregulation has other interesting consequences. A recent study confirmed what many women in the workplace have long suspected—that the air conditioning is set too low. In fact, air conditioning is set for the thermoneutral zone of a 40 year old man, while women generally have higher thermoneutral zones (Kingma and van Marken Lichtenbelt, 2015). Setting air conditioning to allow higher temperatures may reduce overall energy demand of the city.
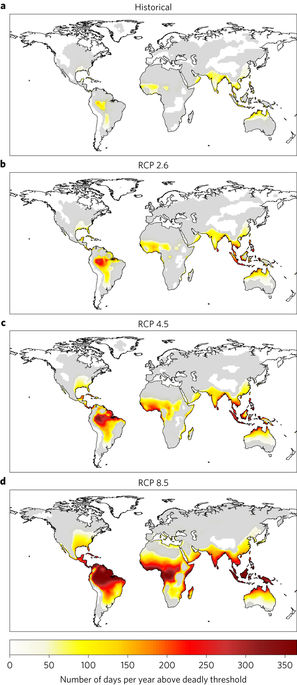
The number of days each year that exceed limits in which heat can be deadly for humans. a) The average number of lethal heat days between 1995 and 2005. b) – d) Projected average days in 2100 under differing climate change scenarios. b) Scenario RCP 2.6 represents rapid and immediate decline in greenhouse gas emissions, c) Scenario RCP 4.5 represents a later decline in greenhouse gas emissions and d) Scenario RCP 8.5 represents a “business as usual” model where emissions are not reduced. Figure from Mora et al. 2017 Nat. Clim. Change.
Given these relationships, the change in global energy demand (and burning of fossil fuels) that may have occurred due to the Anthropocene is hard to quantify, since it depends on how much time different cities around the world spend in their own thermoneutral zones. But with increased warming, more time spent above the thermoneutral zone, particularly in tropical cities, may end up rapidly increasing the amount of energy we spend in our extended phenotype of the thermoregulated city. In fact, the large Asian cities of Hong Kong, Seoul, and Tokyo have increased their thermoregulatory energy demand by ~10% over the past 20 years, and this is projected to increase with climate warming (Spandagos and Ng, 2017).
But sometimes the amount of thermoregulation we can create in our city isn’t enough. In 2003, an unusual heat wave hit Europe that broke records set in 1540, killing at least 70,000 people. In fact, over the past 34 years, 164 cities across the globe have experienced heat waves that have led to the deaths of hundreds of thousands of people (Mora et al., 2017). A total of 30% of the world’s population is currently at risk of such extreme heat events, and projected climate change suggests this will increase to over two thirds of the human population. (See this interactive map of lethal heat days.) And as temperatures warm, increased demand on city-wide energy grids will make brown-outs much more likely.
The probability of these lethal heat events is also increasing directly because of urbanization. Because of the energetic costs of thermoregulation, as well as the heat absorption by paved surfaces, cities themselves directly cause warming in the well-documented “heat island effect“. These effects are most pronounced in the heat of the day, adding as much as 12° C in temperature and exacerbating the probability of lethal heat and the costs of cooling.
The heat island effect in cities changes as a function of the type of surface. Figure courtesy of the EPA.
What does this mean for cities in the Anthropocene? Our fragility and tropical evolutionary heritage means we cannot ignore the costs of thermoregulation. Increasing passive cooling techniques like windows, improved glazing, and more park areas can significantly reduce city temperatures and therefore energy use, even in places as warm as the UAE (Taleb, 2014). How we choose to build our cities will significantly change the risk of lethal heat and the risks of increased warming due to energy demand.

Thanks for this fascinating post, Katie! Just came across this from Marcel Harmon on This View of Life: https://evolution-institute.org/article/constructing-our-niches-evolutions-relevance-to-modern-human-society/. He approaches the use of HVAC to handle thermoregulation explicitly from a niche construction, i.e. evolutionary perspective. But he suggests it is explained in terms of group selection. I wonder what you think of his account?